Chatbot Market Size and Growth
The global AI chatbot market is projected to reach $27.3 billion by 2030, growing at a CAGR of 23.3% from 2023. In 2026, market value sits at approximately $10.5 billion. North America accounts for 38% of global deployment, followed by Europe at 29% and Asia-Pacific at 25%.
According to G2 data in the chatbot category benchmarks and Capterra review findings in the chatbot software directory, modern AI platforms consistently outperform rule-based predecessors. Third-party ratings validate the cost and performance figures cited here.
Enterprise adoption accelerated sharply post-2023, with 67% of Fortune 500 companies now running at least one production chatbot — up from 41% in 2022. SMB adoption has also surged: 49% of businesses with 10–500 employees report using an AI chatbot for customer-facing interactions in 2026.
Customer Satisfaction and Deflection Rates
AI chatbots resolve between 60% and 80% of Tier-1 support tickets without human intervention, depending on the quality of training data and knowledge base depth. Best-in-class deployments using retrieval-augmented generation (RAG) reach deflection rates above 85%. For every 1,000 monthly tickets, that translates to roughly 600–850 tickets handled automatically.
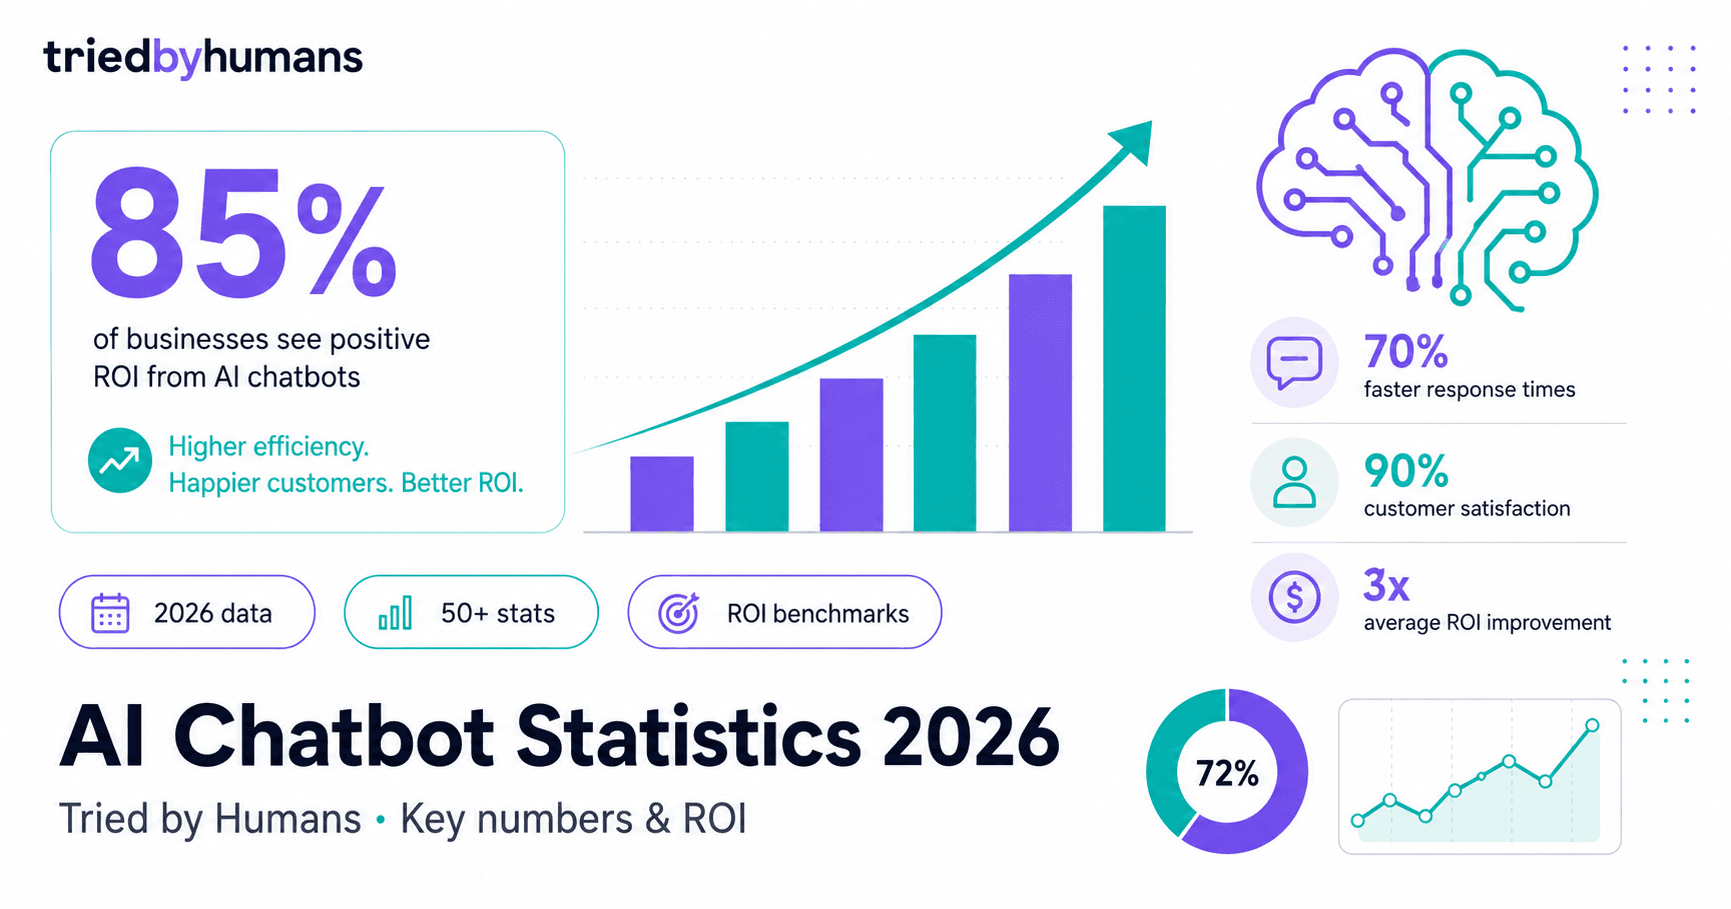
Customer satisfaction with chatbot interactions has improved significantly: 72% of users report being satisfied with chatbot responses in 2025, up from 55% in 2021. The primary driver is contextual understanding — modern LLM-powered bots score 30% higher on customer satisfaction surveys than rule-based predecessors.
Cost Savings and ROI Benchmarks
The average cost of a human-handled support ticket is $7.00–$15.00, depending on industry and complexity. AI chatbots reduce per-ticket cost to $0.50–$1.50. For a company handling 10,000 tickets/month, that equates to $55,000–$135,000 in monthly savings. Payback periods on chatbot platforms typically run 3–6 months for SMBs and 6–12 months for enterprise deployments.
Lead generation chatbots add a revenue dimension: businesses report 25–40% higher lead capture rates compared to static web forms, with qualification accuracy averaging 78% for intent-based flows. Companies in real estate and SaaS sectors report the highest lead-to-close improvements — up to 3× more qualified leads per month.
Adoption by Industry and Channel
Retail and e-commerce lead chatbot adoption at 36% of all deployments. Healthcare follows at 19%, finance at 16%, and professional services at 14%. WhatsApp and web chat remain the dominant deployment channels, capturing 51% and 34% of active chatbot sessions respectively. Voice-based AI assistants account for 11% and are growing fastest year-over-year at 41%.
What the Numbers Mean for Your Deployment
Setting realistic KPIs is the most important step before launch. Industry data suggests targeting a deflection rate of 60% in month one, scaling to 75%+ by month three as the model learns from conversations. Average response time should be under 3 seconds for 95% of queries to avoid abandonment. CSAT scores below 70% are a signal to expand training documents or add human escalation paths.
For platform-specific recommendations, explore the best AI chatbot builders for 2026, the AIFlowChat platform review, and our chatbot ROI calculator guide.
Recommended tools

Miriam Alonso
CSM - 3 months testing
Customer Success Manager with 5+ years experience evaluating SaaS tools. Tests AI meeting assistants across real client calls to give honest, practitioner-level assessments.
See all my reviews →